


My interest in cartography began when I was young, but the study of city plans (or maps) really developed while I was in graduate school studying urban design. It was a number of years later, while I was just beginning my career of teaching urban design theory and history, that I came across two articles by Elbert Peets, “The Background of L’Enfant’s Plan” and “The Genealogy of L’Enfant’s Design of Washington.” In these two articles Peets traces the historic architectural and city scale fabric which he considers as a precedent for L’Enfant’s design of the Washington DC. Peets’ genealogy attributes L’Enfant’s direct influences as Versailles and Christopher Wren’s plan for the re-building of London after the fire of 1666. In “The Background of L’Enfant’s Plan” Peets’ drawings compare streets, relationship and distances of triangles, and scale comparisons of building fabric.
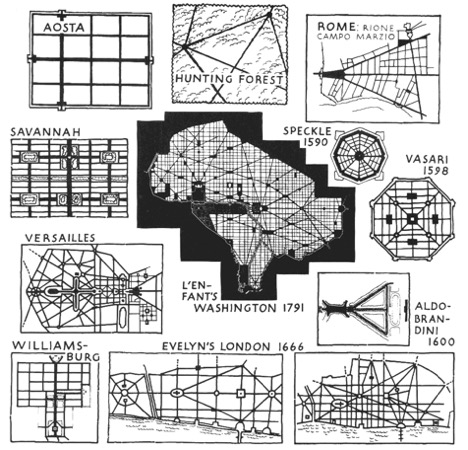
In “The Genealogy of L’Enfant’s Design of Washington” Peets further traces the genealogy of Washington D.C. outlining Roman legionary camps, hunting forests, and early French town plans.

Through this means of genealogical analysis the observer is able to see a portion of the design process that may have influenced L’Enfant’s design for Washington D.C. Peets’ process of tracing the genealogy led me to consider the possibility of a pattern or typology for city designs, and eventually to the researching and writing “The Genealogy of Cities,” which includes over a 1000 city plans.
The basis for all my research has been the study of historic cities plans. There are primarily two types of city plans, orthogonal and birds-eye. Orthogonal city plans are more accurate, being projected looking straight down, while birds-eye plans show both the footprint of buildings, and projected facades. Due to this projection of facades, the plans are not typically accurate in scale and building footprint.
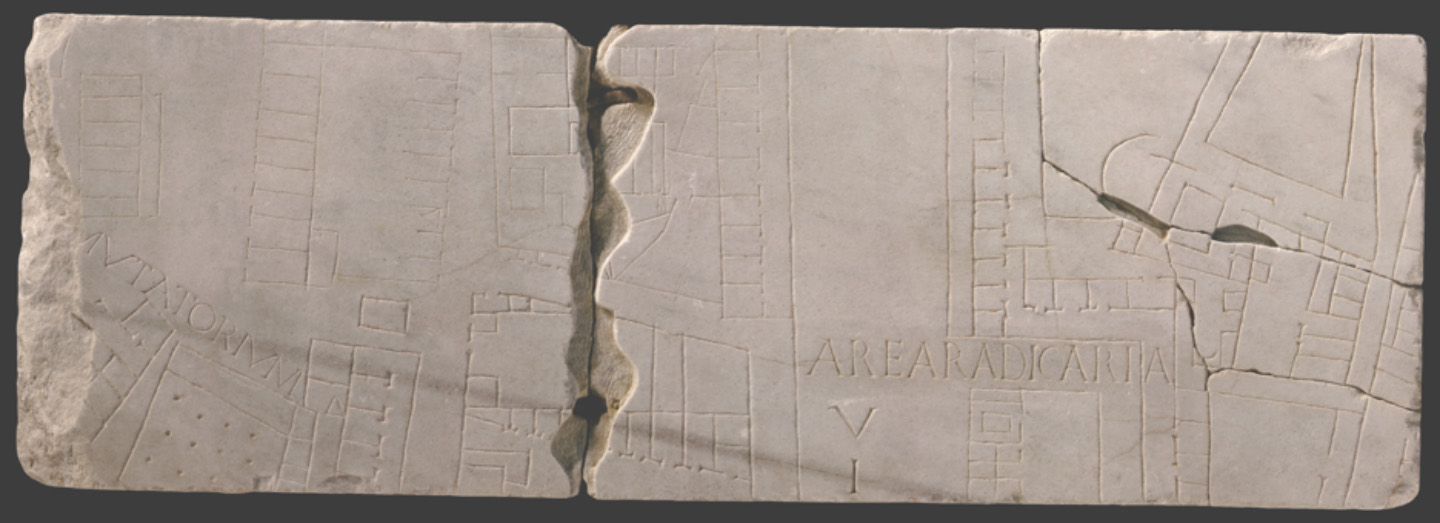
One of the first known precisely rendered city plans is the Forma Urbis Romae, an enormous map of Rome carved between 203-211 BCE and measuring approximately 18.10 x 13 meters (60 x 43 feet). The map was created based on property records, but the function of the map is inconclusive, with some scholars writing that the map served as recording land ownership, while others state that the map was purely decorative. ref “function of the plan.”
This plan covered an entire wall inside the Tempio Pace Parete in Rome. It illustrated the ground plan of every architectural attribute in the ancient city, from large public monuments, to small structures, rooms, and down to the detail of staircases.

Today only fragments exist.
After the Forma Urbis Romae, the process of accurately recording a city in plan seems to have disappeared, but reemerges towards the beginning of the Renaissance, when during the time of Leonardo de Vinci’s stay in Florence (1501—1507) he was commissioned to create a plan for the town of Imola, Italy, circa 1473.
A survey map (located in the Royal Library, Windsor England) of his survives today. This map suggests that Leonardo de Vinci developed his town plan independently, although he may have used the older plan in order to compare his own measurements against it.

Prior though to de Vinci’s map of Imola, city plans were drawn more in an interpretative style and tended to show the sides of buildings, as shown below in the Nuremberg Chronicle, view of Rome, 1493

Even after the recreation of the orthogonal city plan by de Vinci city, city plans continued to be produced in more of an birds-eye view. One of the major city atlas produced was the Civitates Orbis Terrarum, which was published in Cologne between 1572-1617. This great city atlas was edited by Georg Braun and largely engraved by Frans Hogenberg. The atlas eventually contained 546 birds-eye view maps of cities from all over the world.
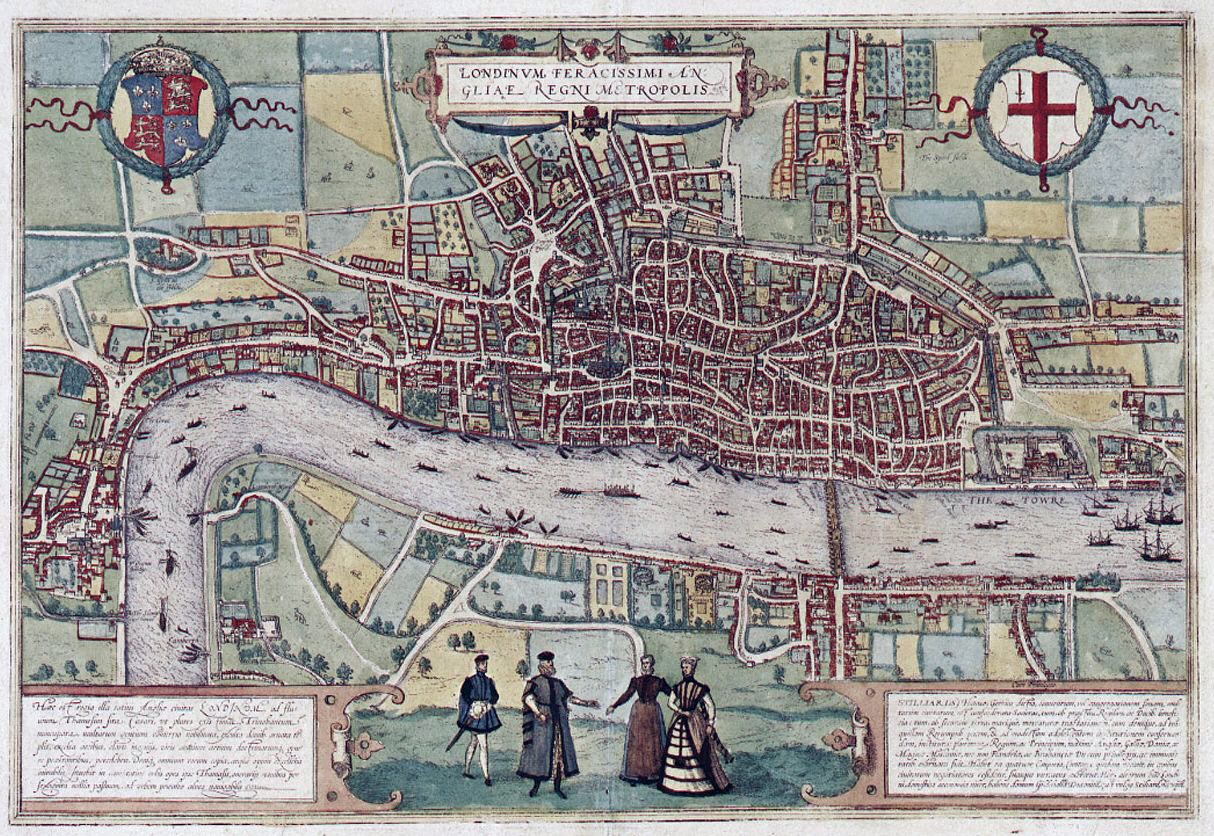
Braun’s motives for adding figures to the views, as stated in his introduction to book 1, that his plans ”… would not in consequence be scrutinized for military secrets by the Turks, as their religion forbade them from looking on representations of the human form.”
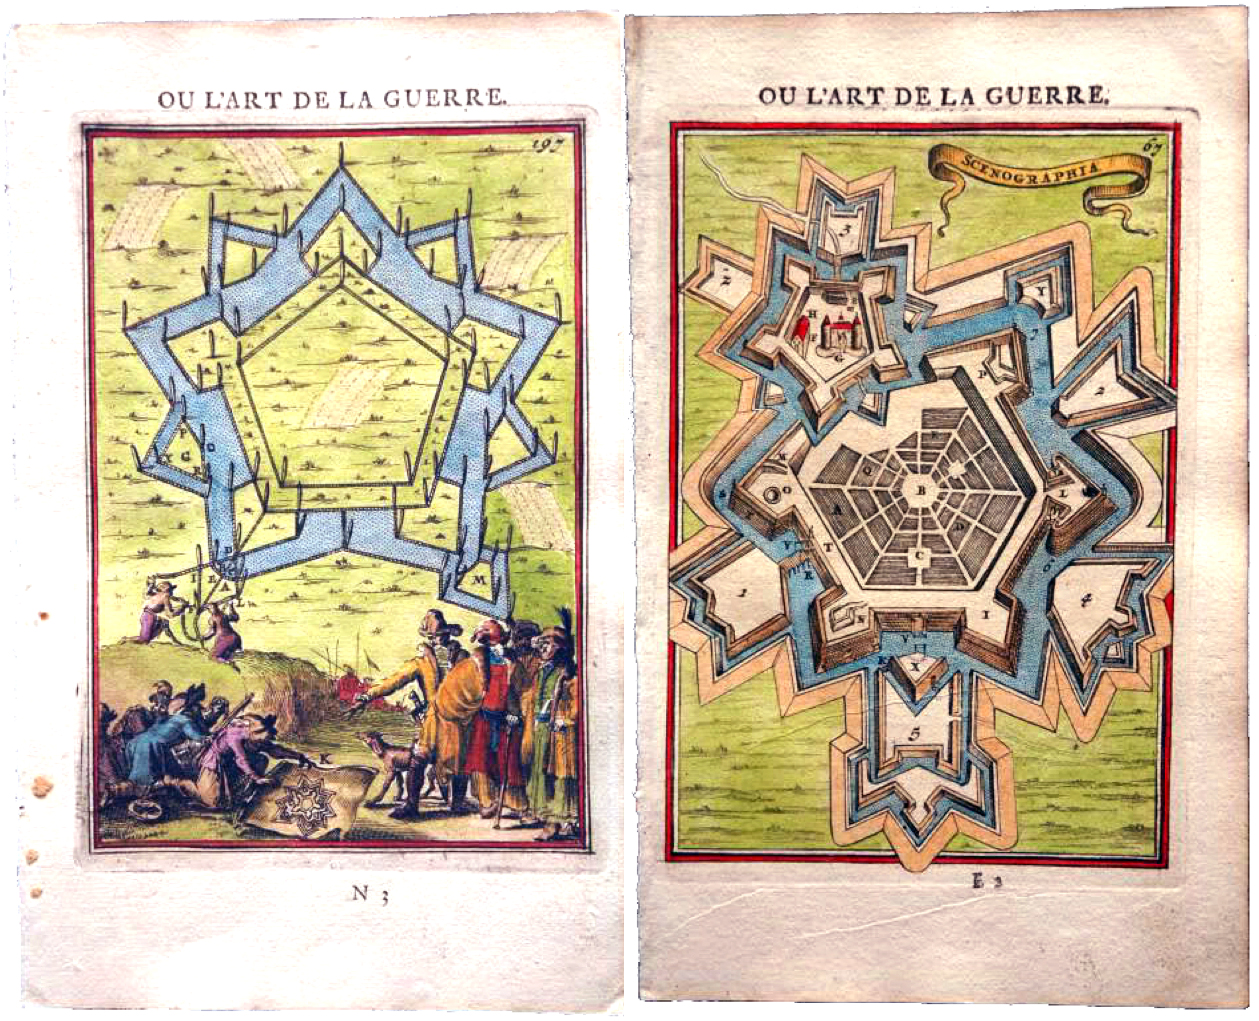
The need for accurate orthogonal city plans comes to the forefront when military engineers begin to document the designs for city fortifications. One of the most famous military engineers was Sébastien Le Prestre de Vauban (commonly referred to as Vauban). Considered the foremost engineer of his time, Vauban (who advised Louis XIV on how to consolidate France’s borders in order to make them more defensible) is known for his skills both in designing fortifications and breaking through them;. His concepts were the dominant model of fortification and siege-craft for nearly 100 years.
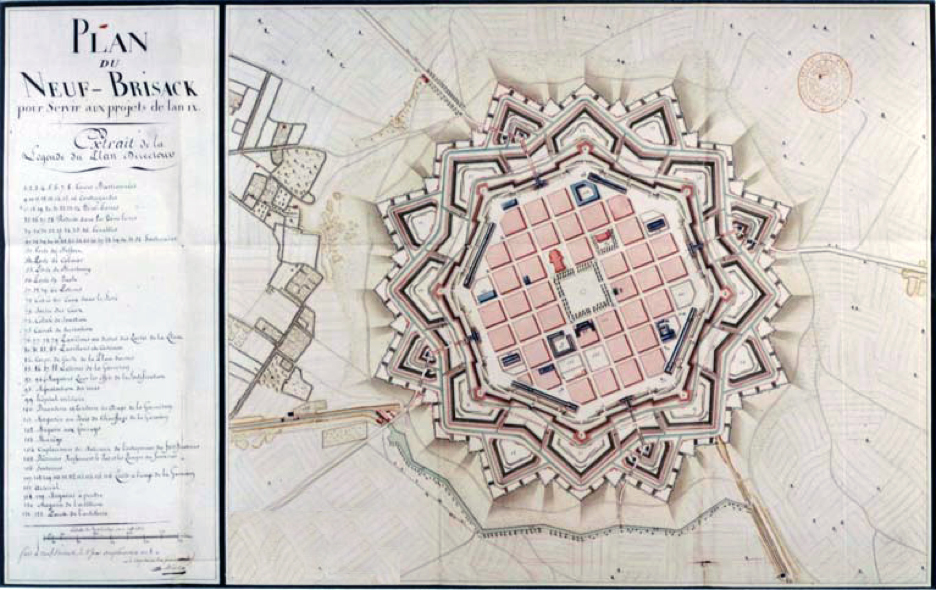
For those interested in further information on Vauban and military engineering look for these two texts by Christopher Duffy, “Fire And Stone: The Science of Fortress Warfare 1660-1860” and “Siege Warfare: in two volumes”. Also, this early book titled ”Les Travaux de Mars ou L’Art de la Guerre”, by Allain Manesson Mallet and published in 1696, has a whole series of illustrations on fortification design as shown below.
Between 1746-1748 there were three city plans produced that stand out as pivotal points in cartography. Jean Delagrive was one of the most eminent French mapmakers of the early 18th century. Delagrive produced the first atlas of Paris and its suburbs, as well as the first detailed plan of the Seine. He was the creator of numerous contemporary plans and maps, including a famous one of the gardens at Versailles dating from 1746 which, like his famous map of Paris, married an exactness of drawing with great precision of detail.

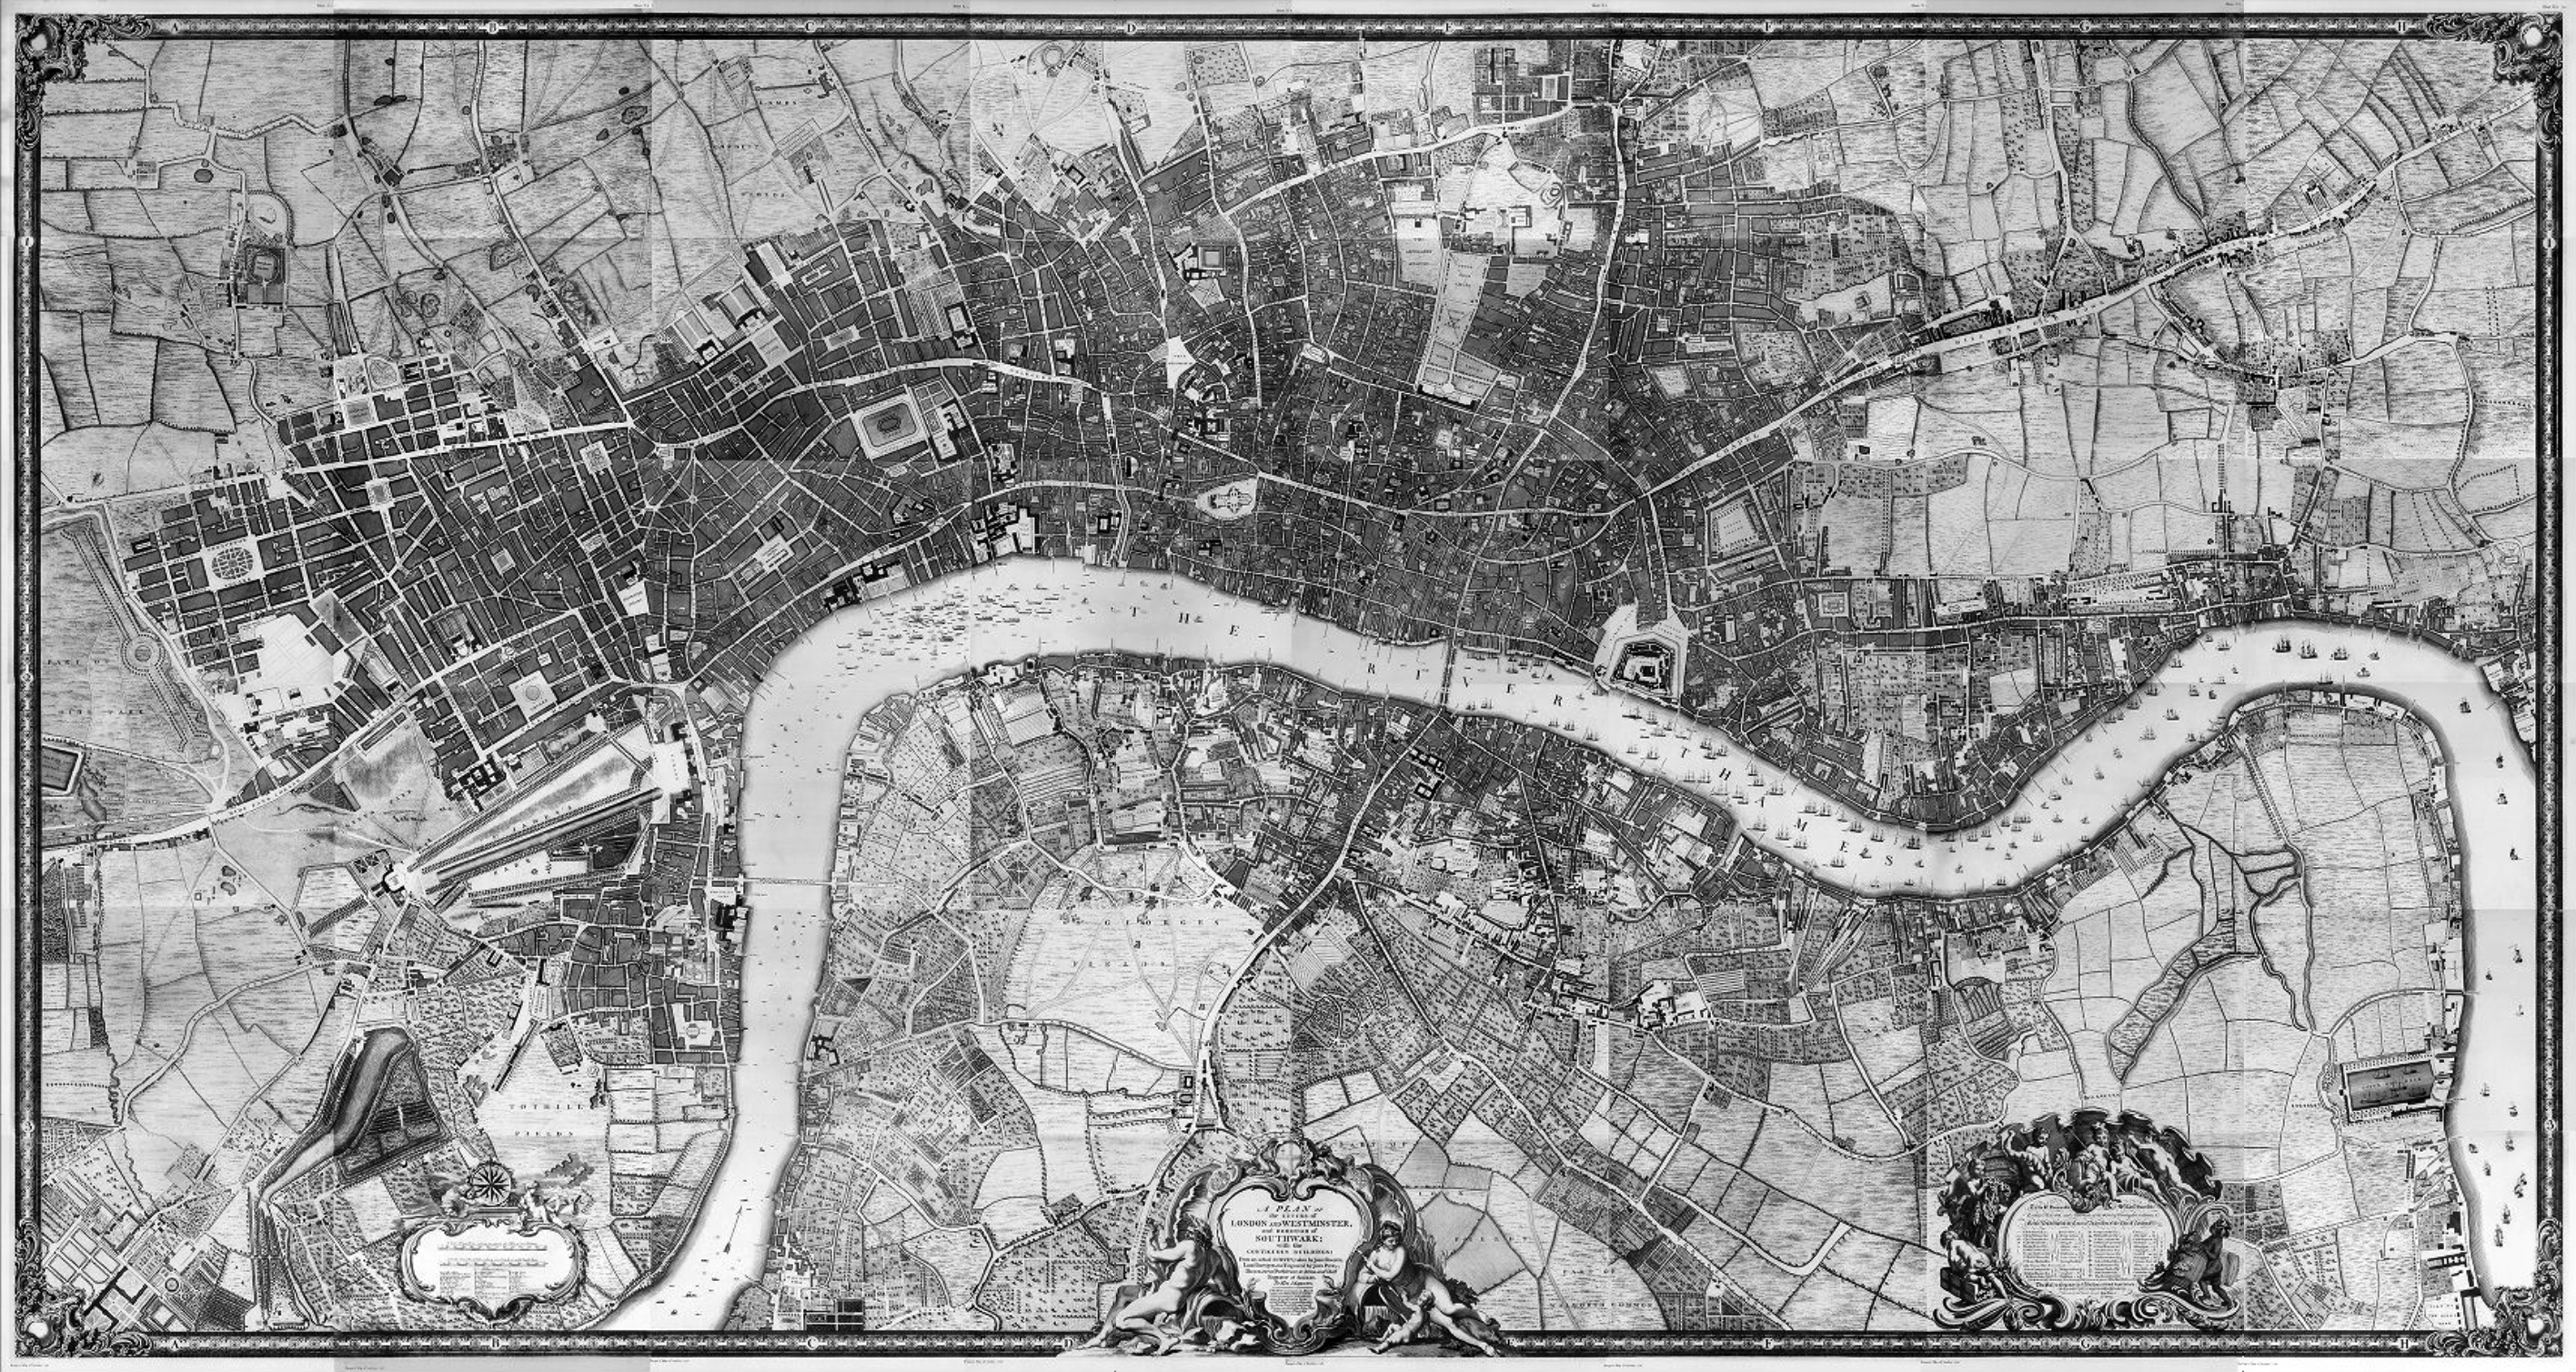
John Rocque was a surveyor, mapmaker, engraver and map-seller. Rocque is mainly remembered for his Map of London, published in 1747. The map consists of twenty-four sheets and is 3.84 by 2.01 meters(12.6ft X 6.6ft) in overall size. It was by far the most detailed map of London published up to that time.
Giambattista Nolli was an Italian architect and surveyor. He is best known for his plan of Rome, the Pianta Grande di Roma which he began surveying in 1736 and engraved in 1748. The plan is commonly called the Nolli Map. The map is composed of 12 copper plate engravings that together measures 176 centimeters (69 in) by 208 centimeters (82 in) and was commissioned by Pope Benedict XIV.

The map is quite important to urban designers, because it shows three levels of usage; public, private, and semi public/private. In the enlarged section of the Nolli Map shown below you can see these three levels of usage. The open areas such as the Piazza Navona are considered public, and accessible 24/7, while the dark hatched areas are showing spaces that are private. The areas showing a portion of the ground floor plan are considered semi public/private, and are open during the day but closed at night. This is similar to what you find in cities today. An example would be the lobby of a hotel, where it’s possible to cut through an urban block, instead of walking around it.

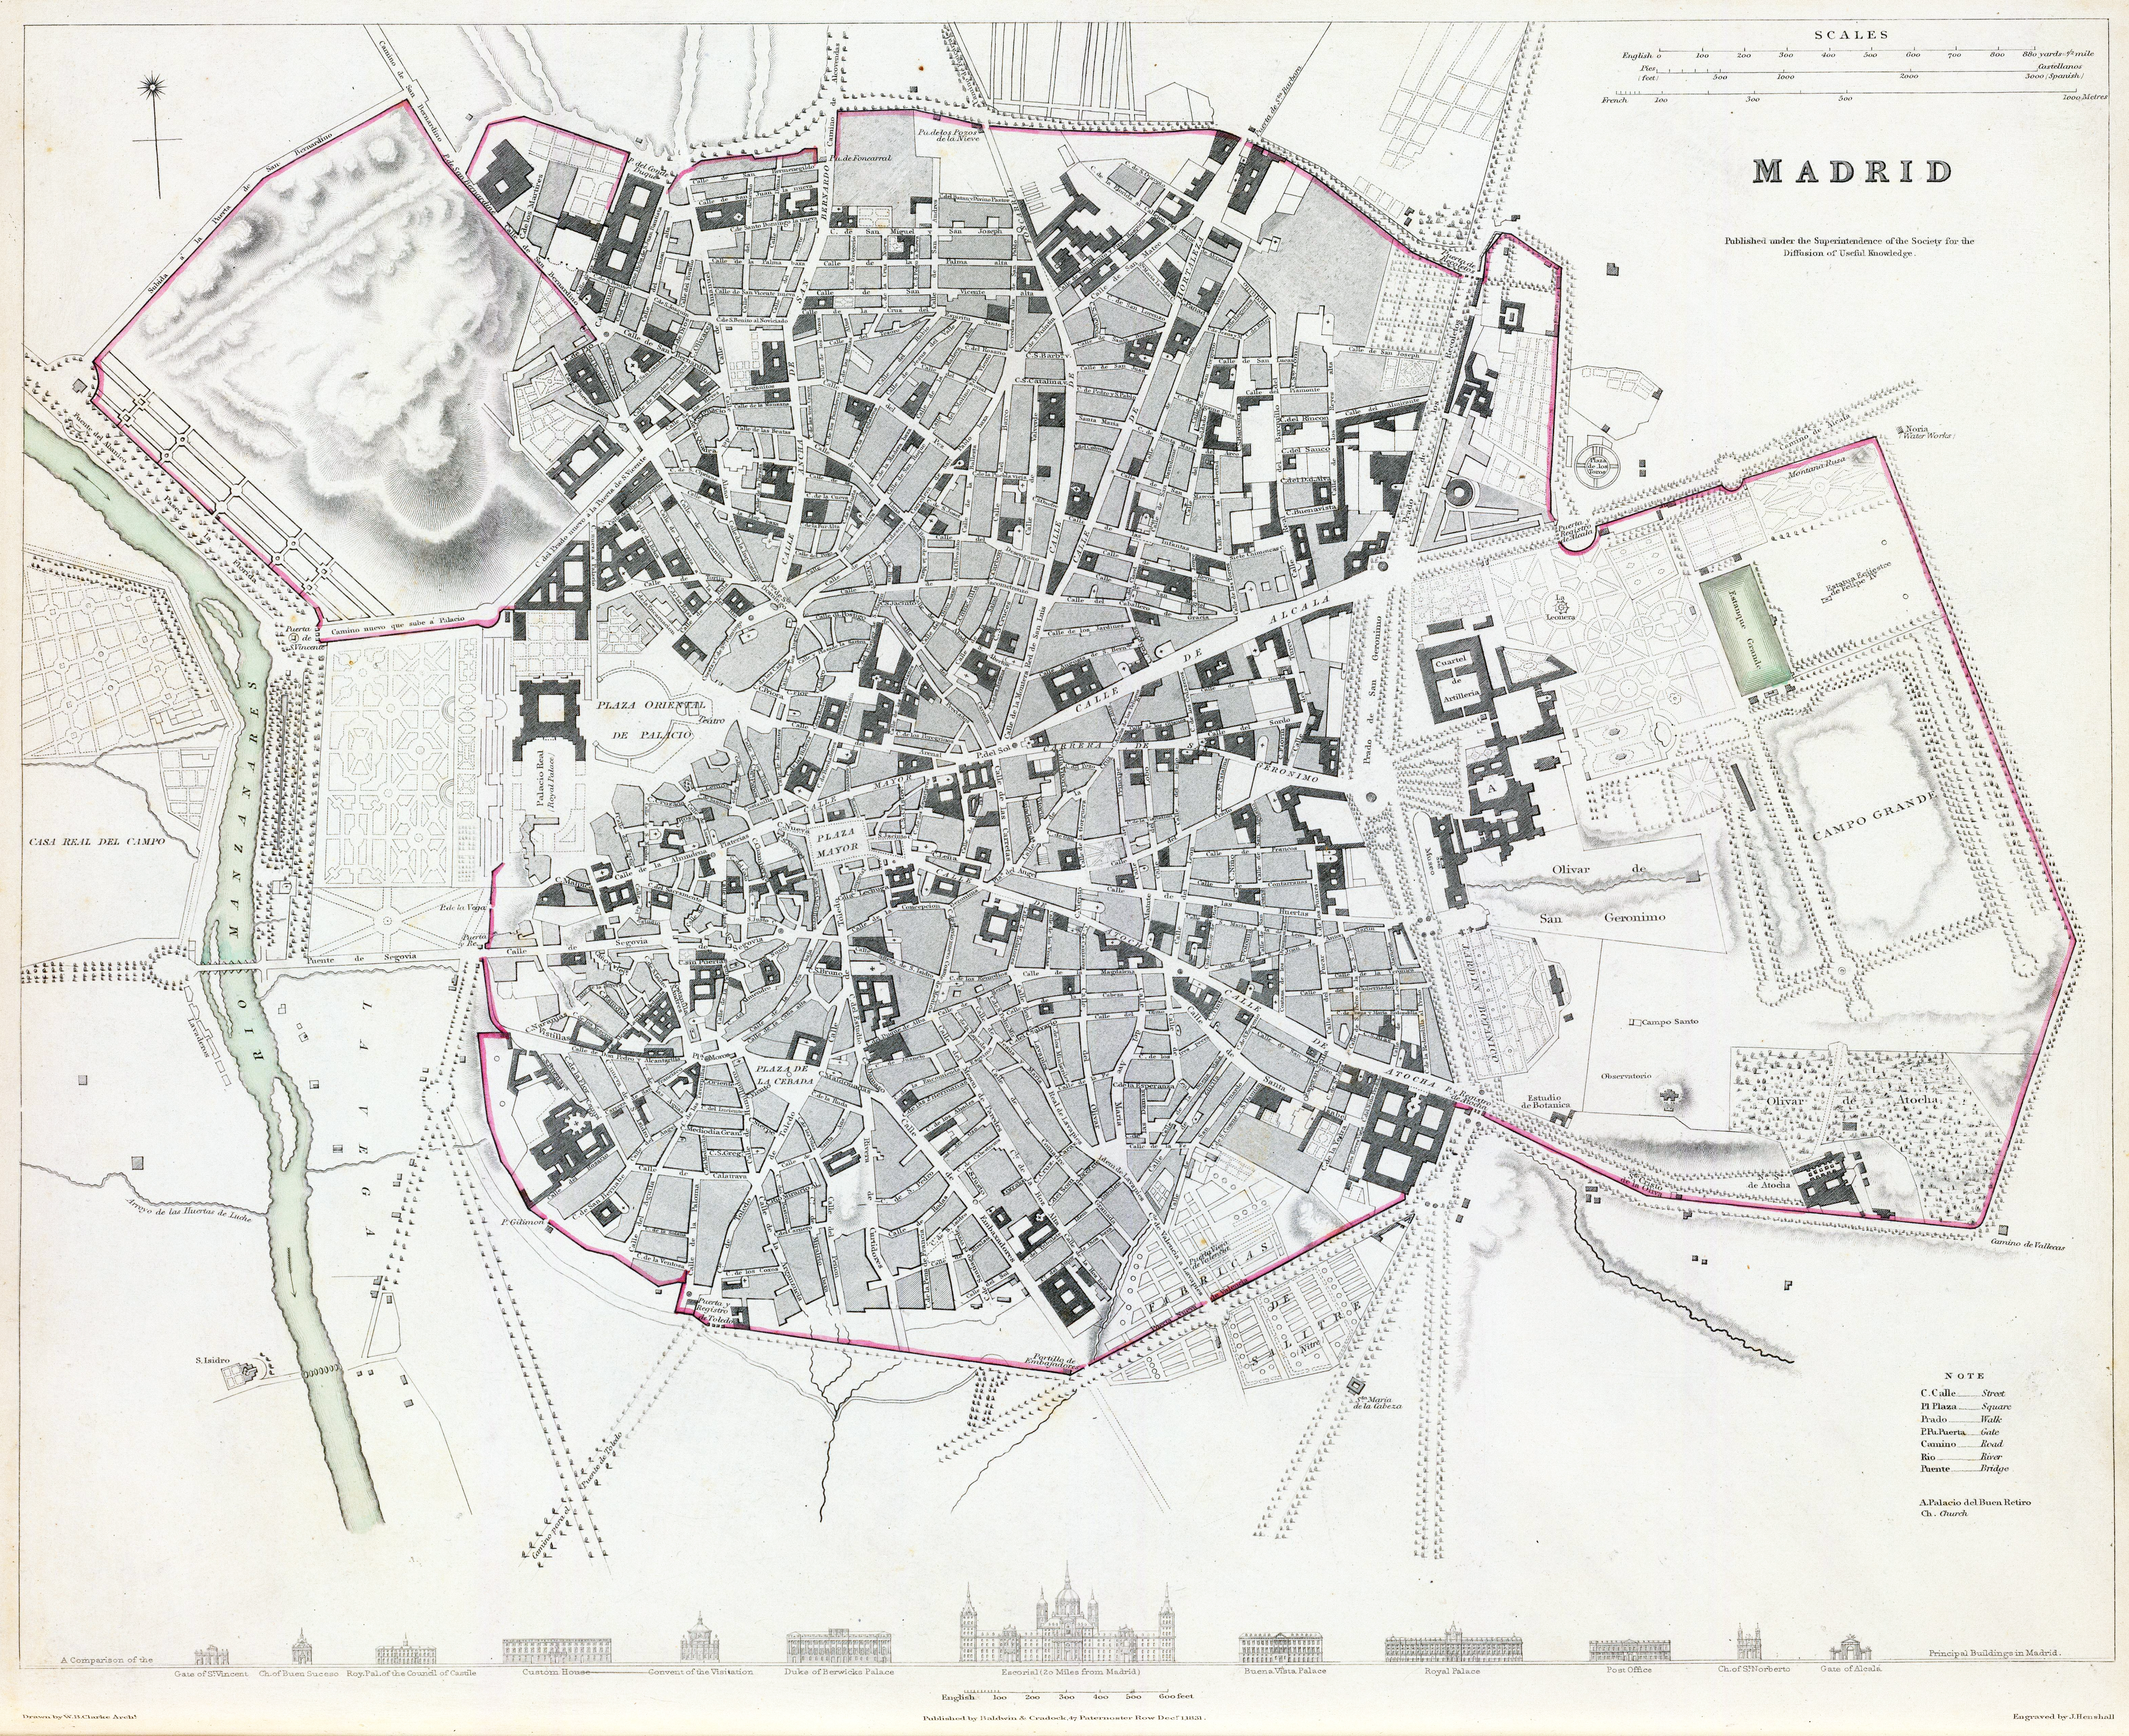
In the 19th century production of maps is more readily available to the public, two sources are worth noting. The first is an atlas produced by Society of the Diffusion of Useful Knowledge, or as it’s commonly known by city map collectors, SDUK. The SDUK published several editions of its atlas, which ranged from 1829-1846. Below is an illustration of Madrid, 1831. The plates typically showed key buildings or views towards the bottom of the map and were usually hand colored.
The second source of city plans were those produced in the travel guides called Baedekers, named after the founder Karl Baedeker. Karl Baedeker was a German publisher and pioneer in the business of worldwide travel guides. The guides were initially published in the 1830’s and contain, among other things; maps and introductions; information about routes and travel facilities; and descriptions of noteworthy buildings, sights, attractions and museums, written by specialists. The recognizable books were red and sized to fit in a coat pocket, 11.1cm X 16.2cm (3.375” X 6.375”).

Rodolfo Lanciani was an Italian archaeologist, and a pioneering student of ancient Roman topography. Lanciani’s great work was the production of a map of the ancient city of Rome titled Forma Urbis Romae. The work was realized as a set of 46 very detailed maps of ancient Rome issued in 1893‑1901. This plan remains unsurpassed to this day, even if there have been many new discoveries since. The individual maps measure 63.5cm by 91.4cm (25″ X 36″) and were drawn at a scale of 1:1000. The scheme of the map outlines the ancient buildings of features of Rome in gray, latter buildings in black ink, while the modern city is rendered in red.

In the x-ray of historic layers shown above in plate 18, it’s interesting to see where St. Peter’s tomb was discovered; located directly under St. Peter’s baldachin, and within the Basilica (shown in red, with the early church shown in black). You can just discern that this spot is outside the roman circus (shown in gray), where St. Peter was possibly crucified.
———————————————————————————————————————————–
I’ve shown you just a small example of city plans. When I began to undertake the research for my book I realized I would need access to a large number of historic city maps. Early on I had a list of dealers throughout a number of major cities, and I was either buying city plans, books, etc., or frequenting libraries. Below are some examples of maps I collected.

I was about 1-2 years into my research when browsers on the world-wide-web began to come into use. Eventually a number of sources started to scan their city maps, making it easier to find city maps I would eventually use. The maps were all digitized and then redrawn, enabling them to be compared. Below are the drawing formats I developed.
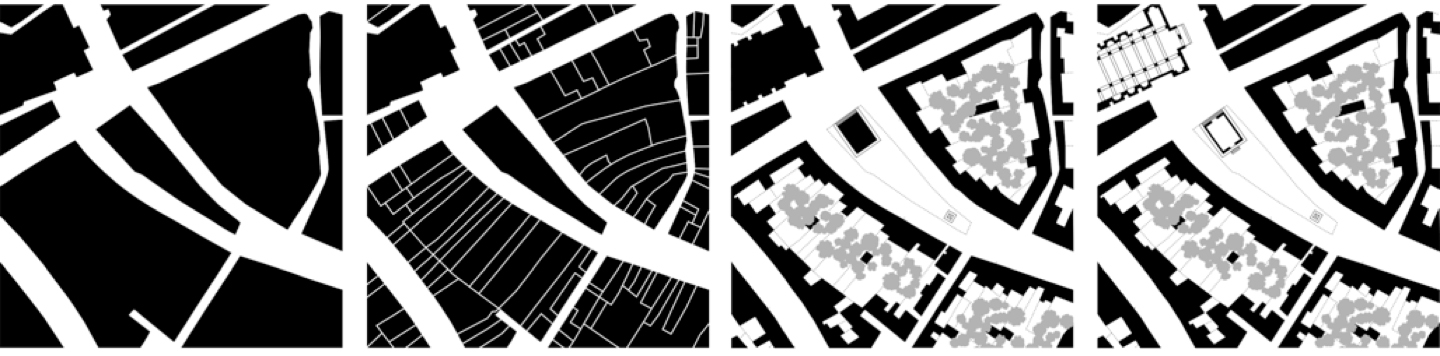
Box 2 – Shows the outline of the block with a division of property lines.
Box 3 – Shows the footprint of the buildings, with possible property division, and foliage as a grey mass.
Box 4 – Shows the footprint of the buildings, with key public/private buildings shown in ground plan, possible property division, and foliage as a grey mass.
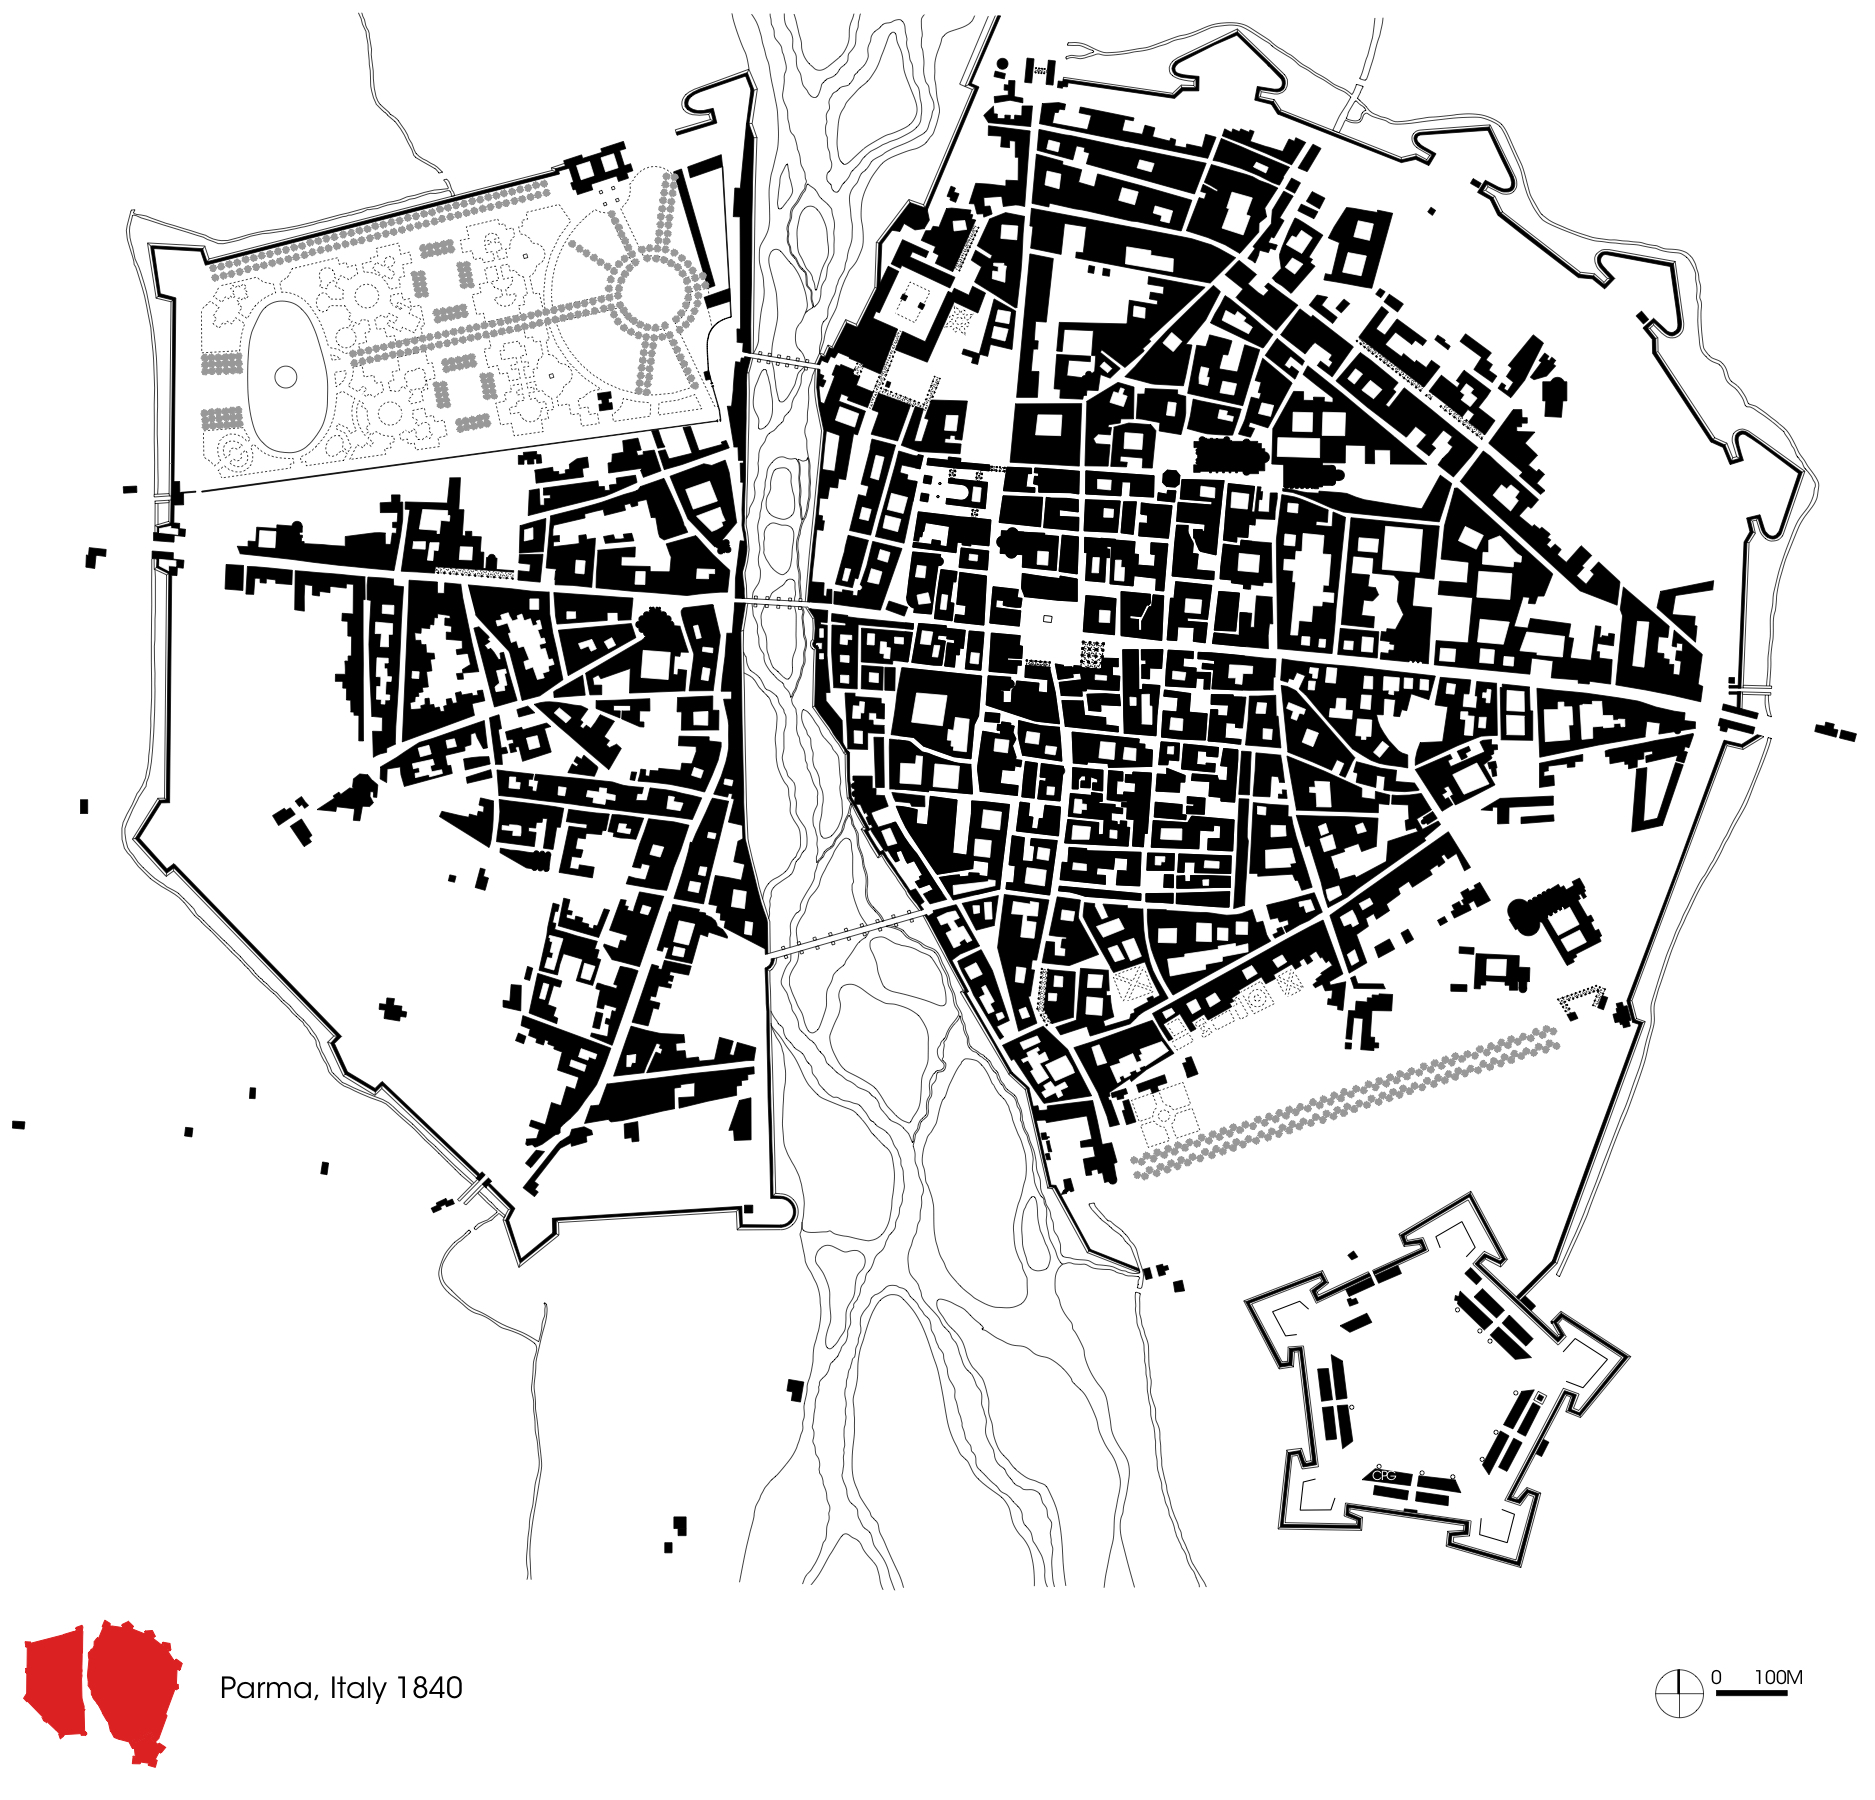
Below is the original SUDK map of Parma, and then the plan of Parma redrawn for my book.

The plan below shows a two-page spread from The Genealogy of Cities. The city plans are of Bath, England, left to right 1300-1790.

As I mentioned, I’ve shown you only a small example of historic city plans, but if you’re interested you can find a large surplus of historic city maps on the web. For further information on the historic city maps and cartography I recommend two sites. These are, David Rumsey Map Collection and the Jewish National and University Library. If you have any questions or comments, please feel free to respond.
————————————————————————————————————————————-
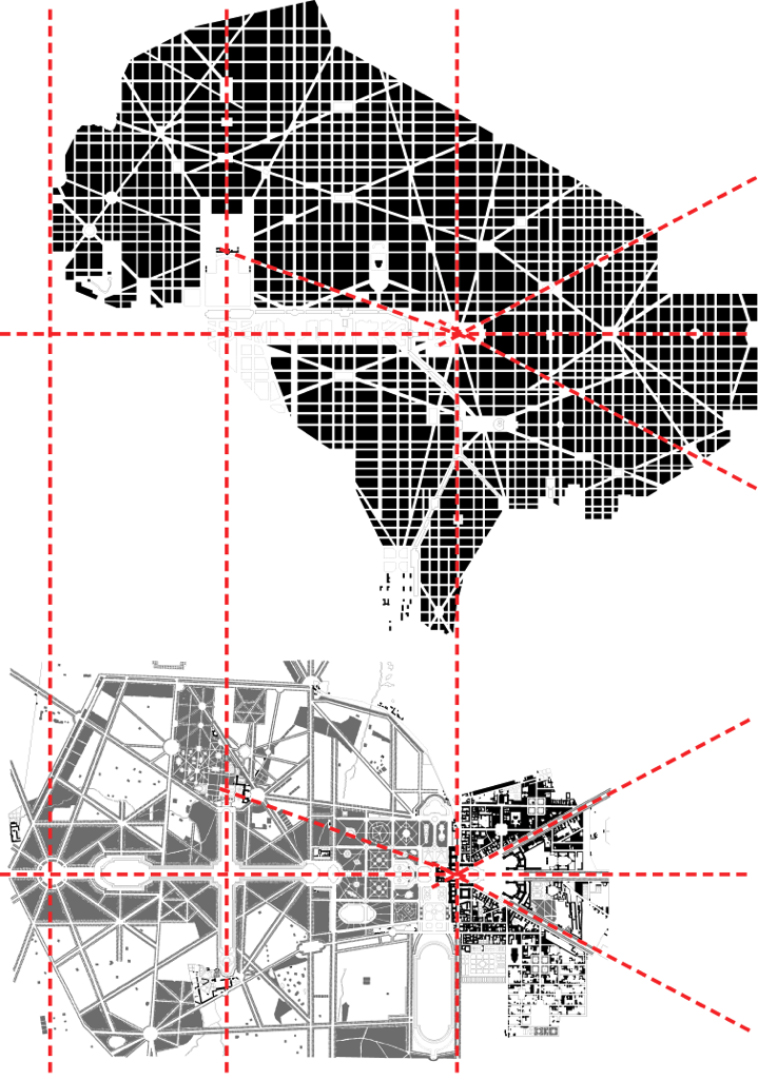
An addendum – The image below is from an article I published in Clog: National Mall, published in November 2012. The article is titled, L’Enfant’s Plan for Washington, D.C., and a Precedent: the Plan of Versailles.
The image shows both the redrawn plans of Washington D.C. and Versailles at the same scale, and aligned. Note the similarities L’Enfant took directly from the design of Versailles.
